5. Predictive Model
5.1 Model Design
One attempt to check whether the sentiments have an influence on the players performance at all and therefore to investigate our findings in the correlation analysis was to set up a random forest regression model to predict the BPM of players. We used different models and compared the BPM predictions. The following models were used:
- mean BPM of the last 5 BPMs as a baseline model
- model including only the sentiment scores
- model including the last 5 BPMs, Position, Age, Month of the Game, Homegame, Trend, SRS_Team, SRS_Opponent
- model including the last 5 BPMs, Position, Age, Month of the Game, Homegame, Trend, SRS_Team, SRS_Opponent and the sentiment scores
In detail, Homegame expresses whether the player played a homegame (1) or an away game (0). The Trend indicates the teams last 5 game performances - i.e. the sum of wins (+1) and losses (-1) is calculated. In order to measure a more longterm team performance we used the SRS (Simple Rating System) which assigns a score to each team according to their average point difference and strength of schedule (0 marks the average score). The SRS for the previous season was used for the prediction.
5.2 Predictions
For the actual prediction task we started by selecting the relevant columns for the model and split the data into training and testing data with a proportion of 75% training and 25% testing. A validation split was performed in order to combat overfitting. Each model was created using the recipe package. Using tune_grid(), the model parameter mtry (number of predictors that will be randomly sampled at each split when creating the tree models), trees (number of trees contained in the ensemble) and min_n (minimum number of data points in a node that are required for the node to be split further) got tuned. After tuning, we chose the best model fit based on the RMSE (Root Mean Square Error) which calculates the average distance between the predicted values and the true values, i.e. the lower the RMSE, the better the model is able to fit a dataset. The importance score for each variable was saved as well.
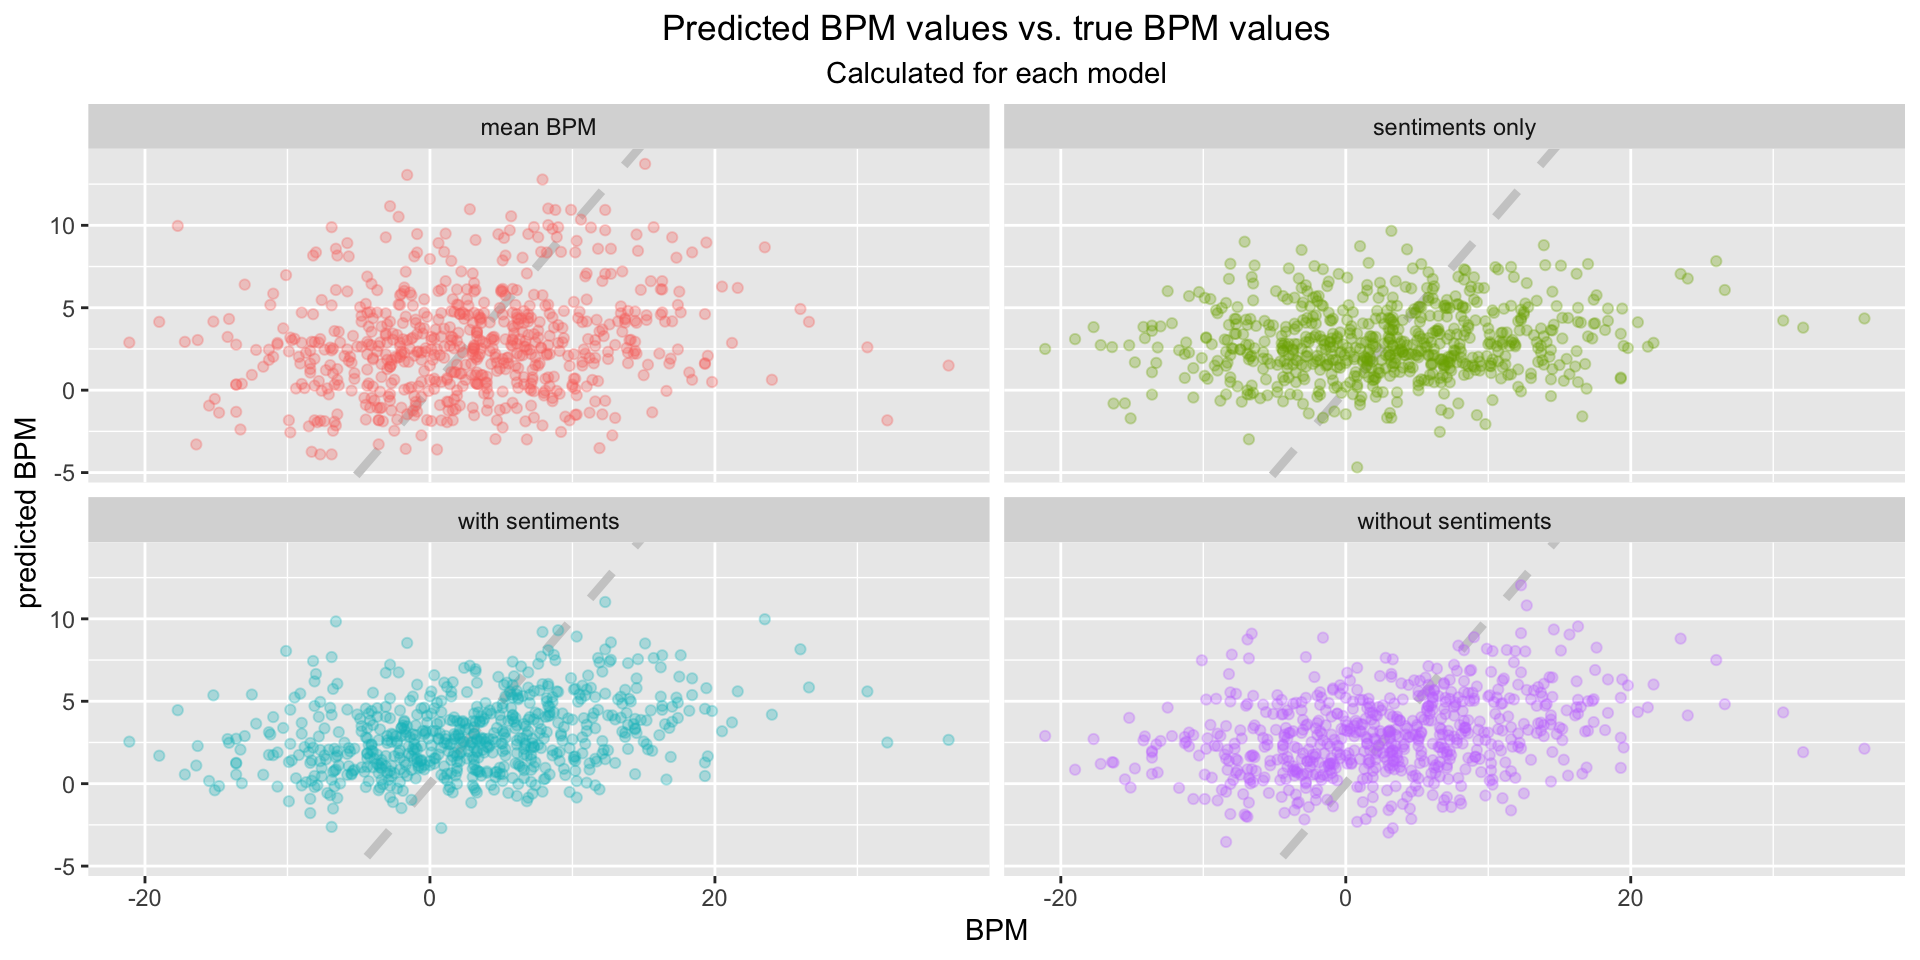
In order to determine which model predicted the BPM performance best, a visualization is shown below that displays the predicted values (y-axis) and the true values (x-axis) for each model, meaning a perfectly fitted model would align all points on the dashed line. The visualization doesn’t allow a clear interpretation since all models are scattered and no specific trend can be observed.
5.3 RMSE and RSQ
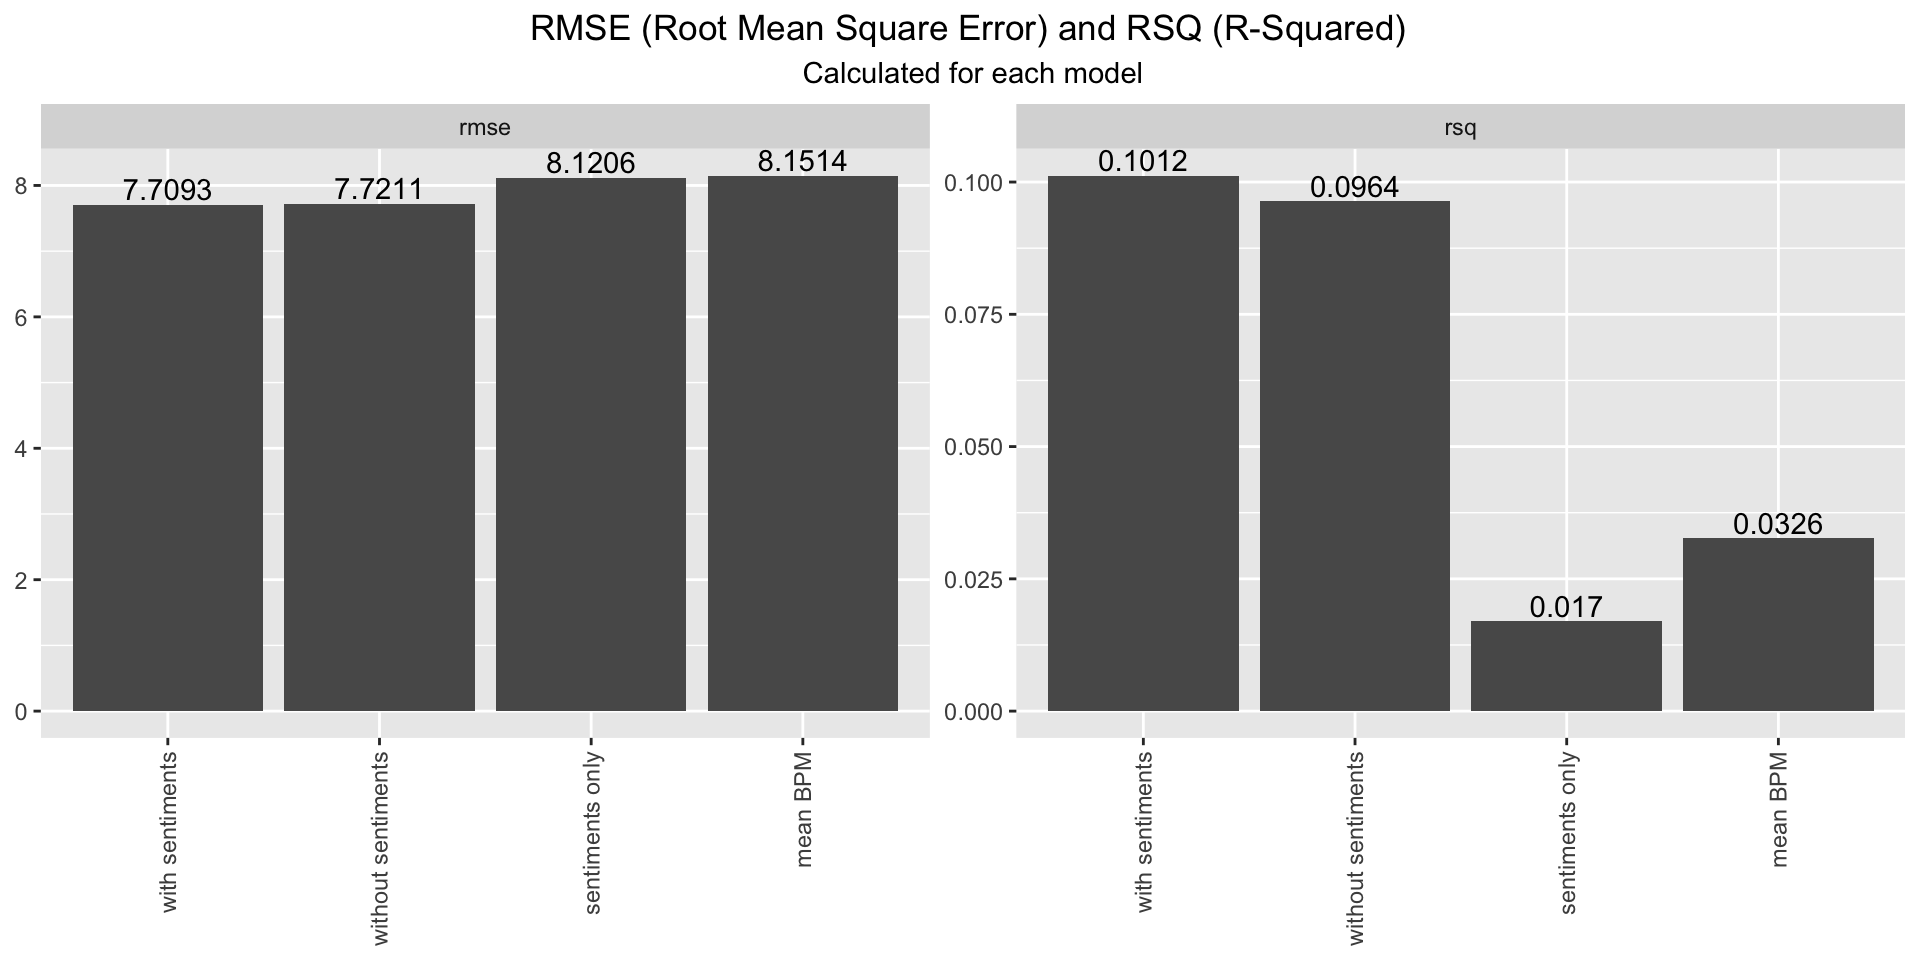
Therefore, to determine which model predicted the values best, the RMSE (Root Mean Square Error: calculates the average distance between the predicted values and the actual values) and RSQ (R-Squared: proportion of variance in the dependent variable that can be explained by the independent variables) was used to further analyze the different models. The bar plot shows that the RMSE are in the range of 7.71 - 8.15. Using RMSE as a metric the model with sentiment scores predicts the BPM best. The difference between the models RSQ on the other hand is quite large. All models don’t explain the BPM well ranging from 0.017 to 0.1012. So even here, a direct influence of the sentiments as a feature can not be derived from the model, underlining our findings in the correlation analysis that the sentiments have no significant influence on a players in-game performance.
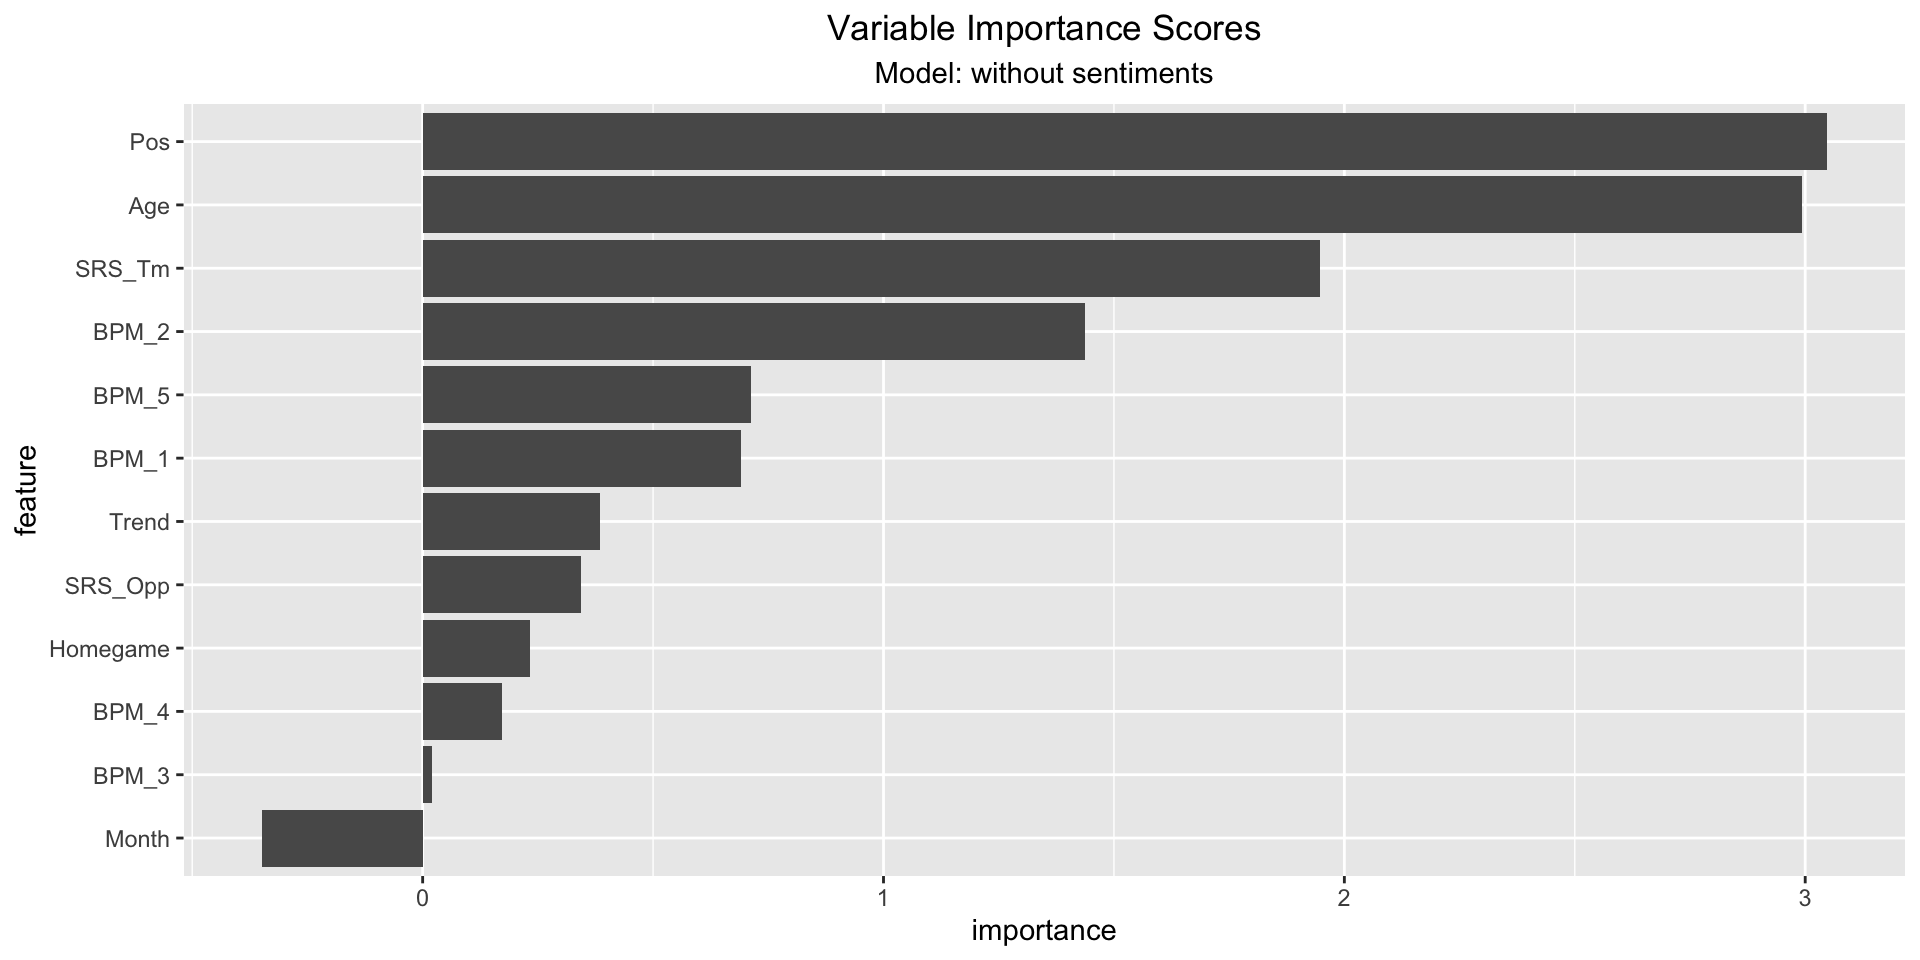
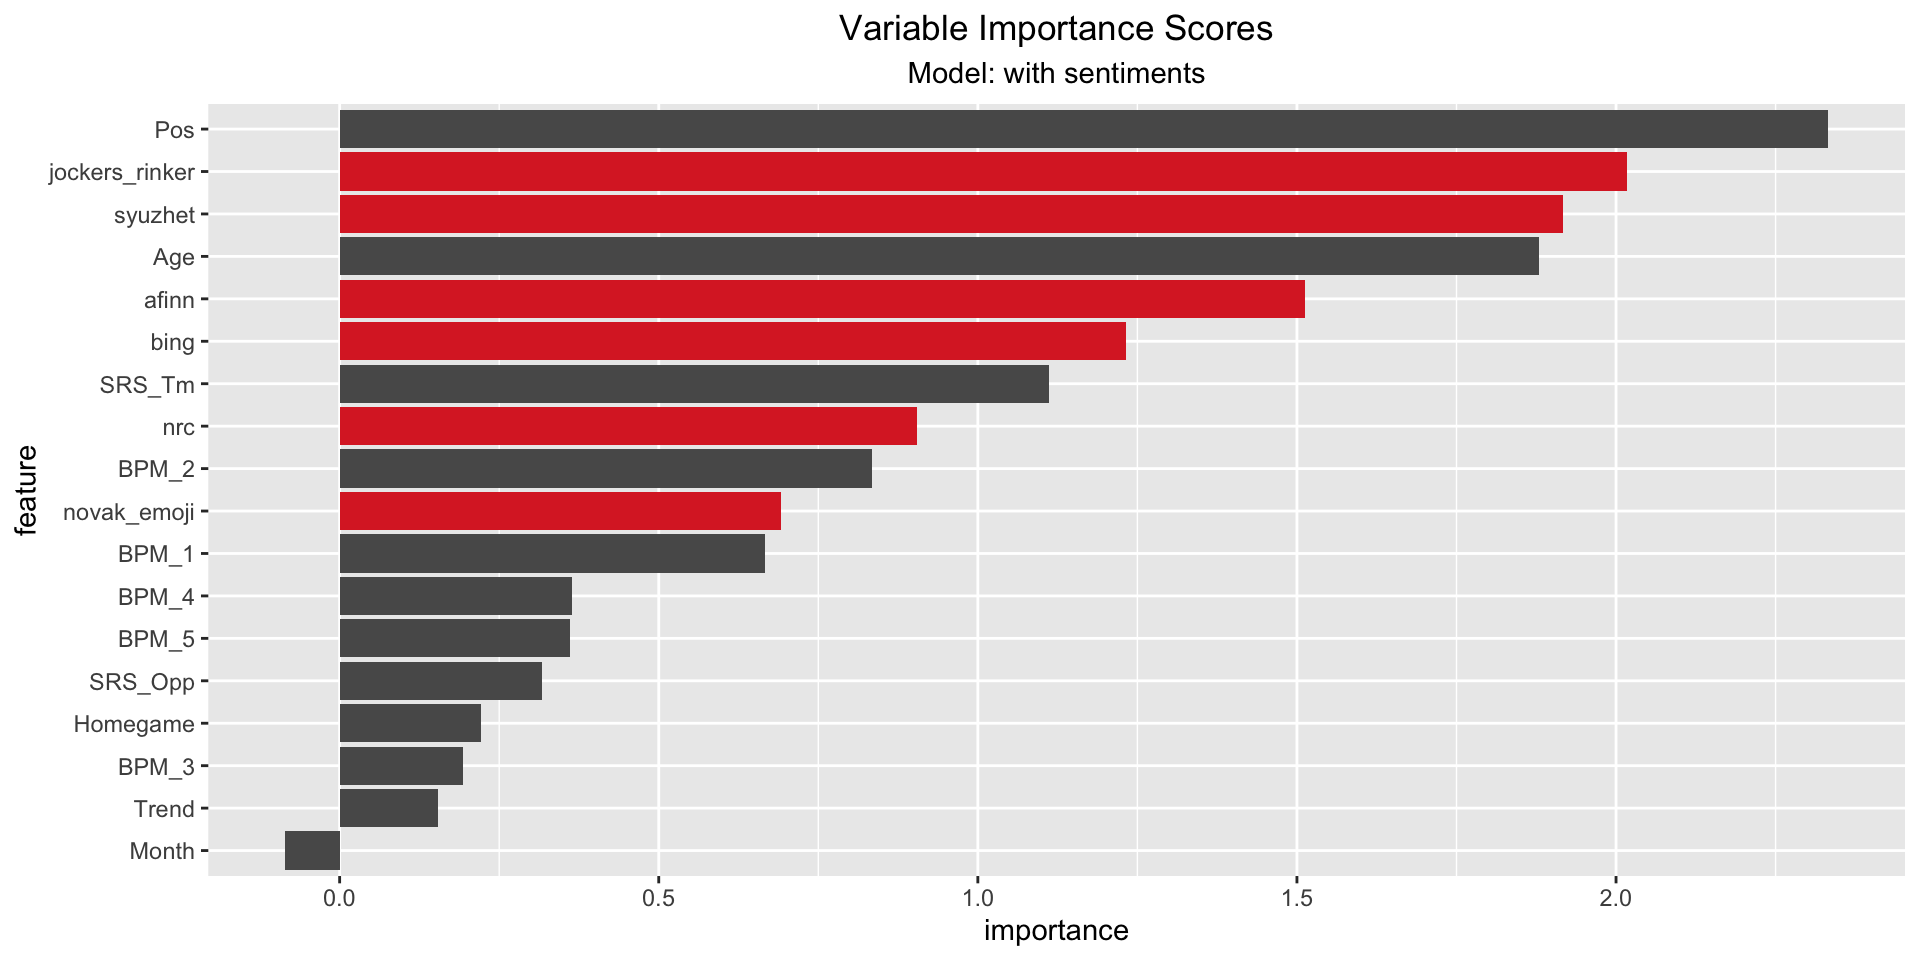
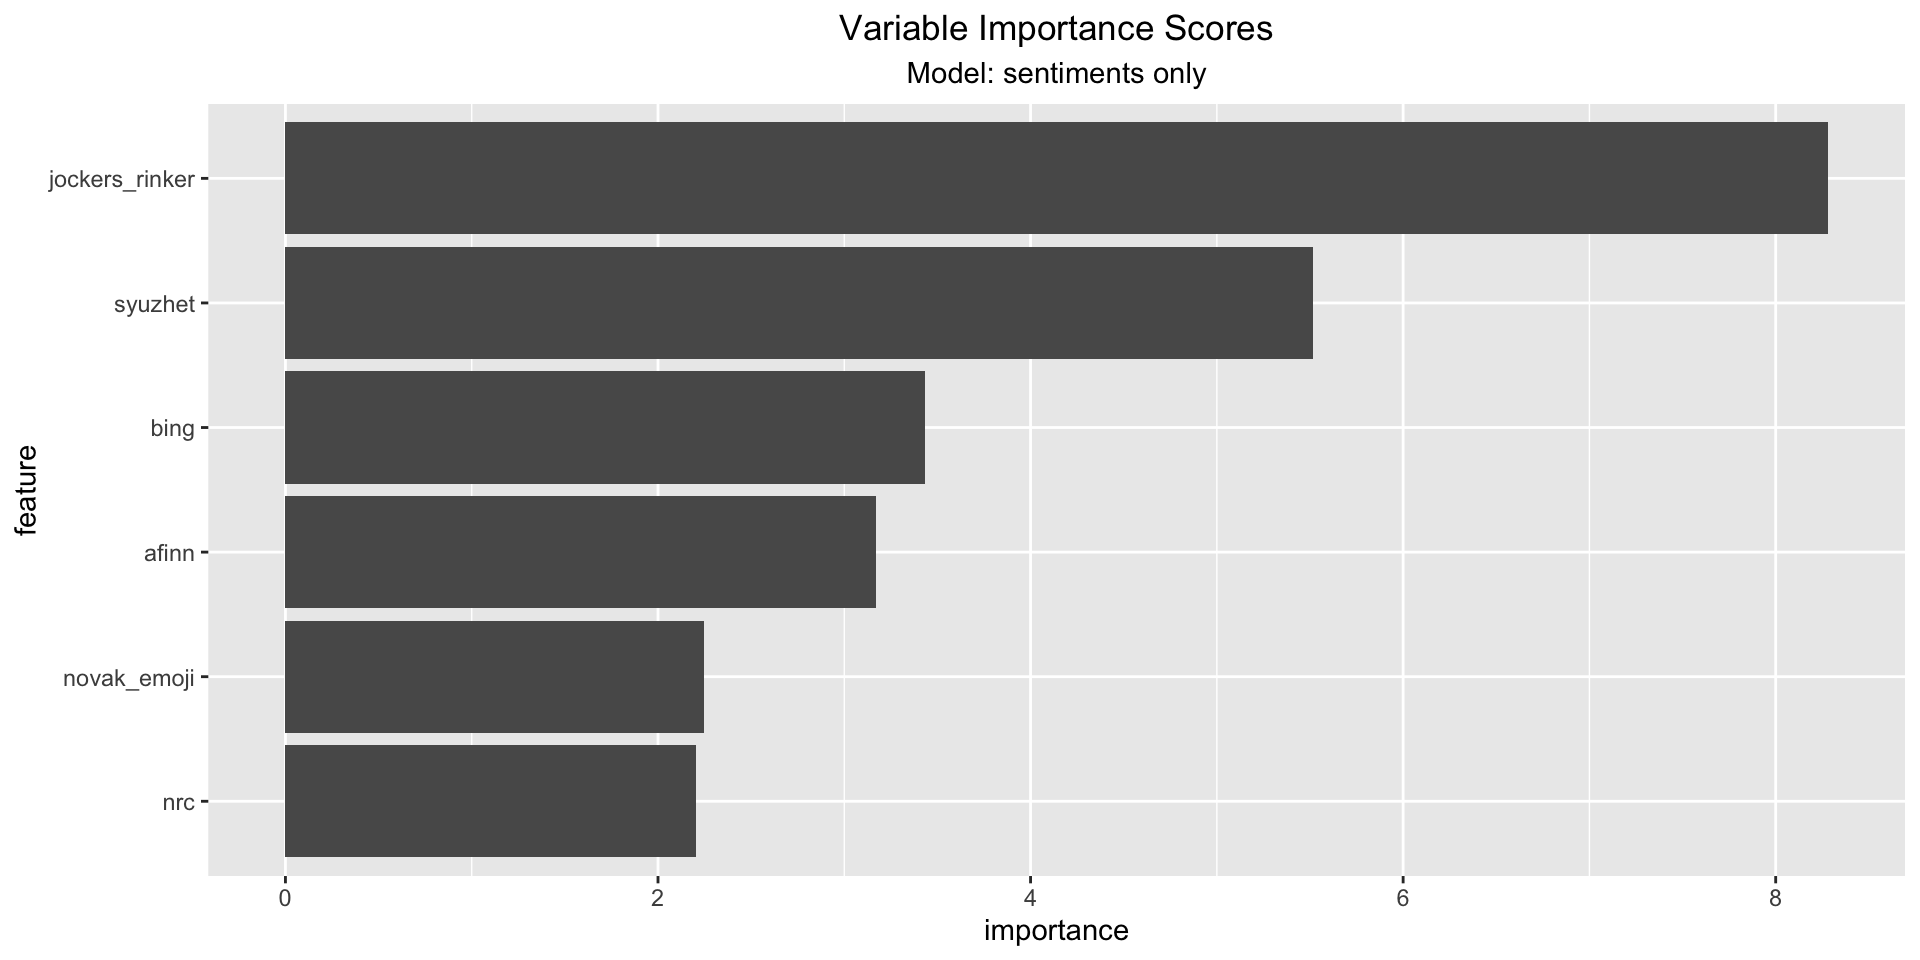
5.4 Variable Importance Scores
As last step we looked at the importance scores of each model - mostly focusing on the model including the sentiments. It can be observed that the afinn, syuzhet and jockers_rinker sentiment scores score high importance scores. The (permutation) importance score is calculated by (1) measuring a basline RSQ , (2) permuting the values of one feature and measure the RSQ. The importance score is the difference between the basline and the drop in overall RSQ caused by the permutation. The plot indicates a high influence of sentiment scores, but since the model has a low RSQ, this should be perceived carefully.